

Introduction
Retention is the lifeblood of any successful business. Acquiring new customers is important, but keeping them is what drives sustainable growth. Yet many businesses struggle to understand why users drop off after their first interaction or purchase. That’s where Cohort Analysis to Improve Retention—a powerful tool that helps you track user behavior over time and uncover patterns that impact retention.
In this blog, we’ll explore what cohort analysis is, why it matters, how to implement it, and how it can be used to improve customer retention across industries like SaaS, e-commerce, mobile apps, and more.
What Is Cohort Analysis?
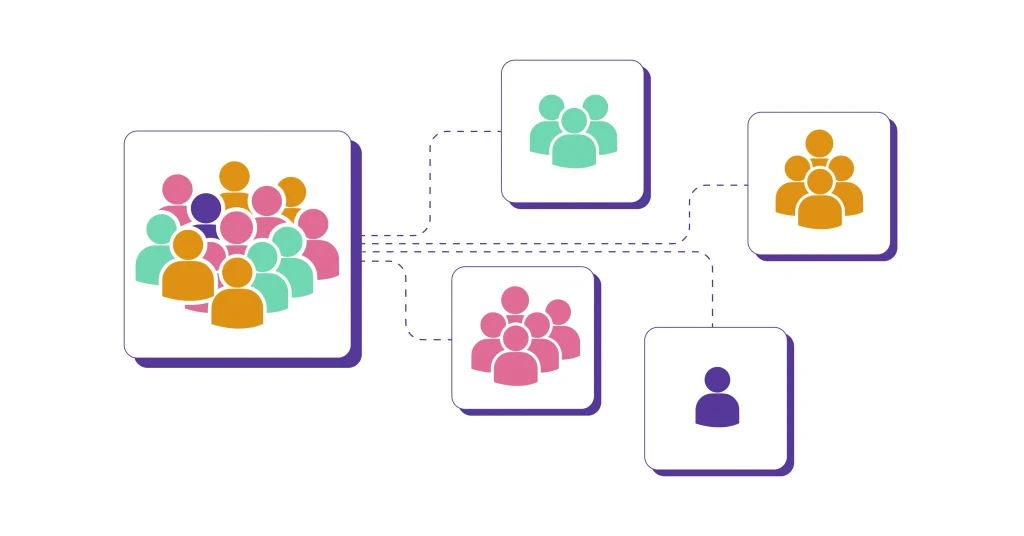
Cohort analysis is a method of grouping users based on shared characteristics or behaviors within a specific time frame and then analyzing how those groups behave over time.
Common Cohort Types:
- Acquisition cohorts: Users grouped by the date they signed up or made their first purchase.
- Behavioral cohorts: Users grouped by actions taken (e.g., used a feature, clicked a CTA).
- Segmented cohorts: Based on demographics, device type, location, etc.
By comparing cohorts, you can identify trends, measure retention, and understand what drives long-term engagement.
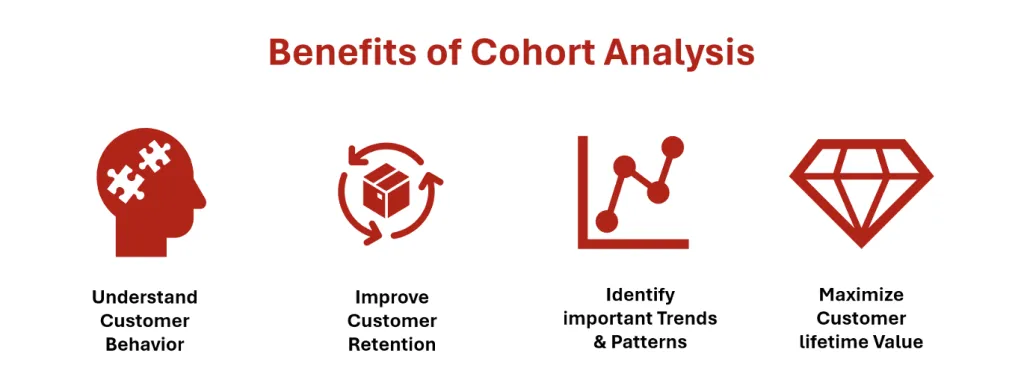
Why Cohort Analysis Matters for Retention
Retention metrics like churn rate and customer lifetime value (CLV) are critical, but they don’t tell you why users leave. Cohort analysis fills that gap by:
- Revealing drop-off points in the user journey.
- Identifying high-performing segments that retain better.
- Measuring the impact of changes (e.g., onboarding tweaks, pricing updates).
- Tracking long-term behavior beyond initial engagement.
It helps you move from reactive to proactive retention strategies.
How to Set Up a Cohort Analysis
1. Define Your Goal
Start with a clear question:
- Are users who signed up in January more likely to churn than those in March?
- Does onboarding completion affect 30-day retention?
2. Choose Your Cohort Type
- Acquisition cohorts are great for tracking retention over time.
- Behavioral cohorts help you understand the impact of specific actions.
3. Select Your Metrics
Common retention metrics include:
- Day 1, Day 7, Day 30 retention
- Repeat purchase rate
- Feature usage frequency
- Churn rate
4. Use the Right Tools
Popular tools for cohort analysis:
- Google Analytics
- Mixpanel
- Amplitude
- Tableau
- Looker
- Excel or Google Sheets (for manual analysis)
Visualizing Cohort Data
Cohort analysis is often visualized using a cohort retention table or heatmap, where rows represent cohorts and columns represent time intervals (days, weeks, months). The values show the percentage of users retained at each interval.
Example:
| Cohort | Week 0 | Week 1 | Week 2 | Week 3 |
|---|---|---|---|---|
| Jan 1 | 100% | 60% | 45% | 30% |
| Jan 8 | 100% | 65% | 50% | 35% |
This format makes it easy to spot trends and compare performance across cohorts.
Using Cohort Analysis to Improve Retention
1. Optimize Onboarding
If early cohorts show high drop-off in the first week, your onboarding may be too complex or unclear. Use cohort data to test and refine onboarding flows.
2. Identify Sticky Features
Behavioral cohorts can reveal which features correlate with long-term retention. Promote these features during onboarding or in marketing campaigns.
3. Segment by Acquisition Channel
Compare cohorts based on how users found you (e.g., paid ads vs. organic search). This helps you invest in channels that drive high-retention users.
4. Test Pricing and Offers
Run cohort analysis on users exposed to different pricing models or promotions. See which offers lead to better retention and repeat purchases.
5. Track Product Changes
After launching a new feature or redesign, cohort analysis can show whether retention improved or declined.
6. Improve Customer Support
If certain cohorts show higher churn, investigate support interactions. Poor support experiences can drive users away.
Cohort Analysis in Different Industries
SaaS
- Track trial-to-paid conversion rates.
- Measure feature adoption and usage over time.
- Identify churn triggers and retention drivers.
E-commerce
- Analyze repeat purchase behavior.
- Compare retention across product categories.
- Measure impact of loyalty programs.
Mobile Apps
- Monitor app usage frequency.
- Identify retention patterns based on device or OS.
- Test onboarding flows and push notification strategies.
Common Mistakes to Avoid
- Too broad cohorts: Grouping all users together hides insights.
- Ignoring external factors: Seasonality, marketing campaigns, or bugs can skew results.
- Overlooking qualitative data: Combine cohort analysis with user feedback for deeper insights.
- Failing to act: Insights are only valuable if they lead to action.

Advanced Tips
- Combine cohort analysis with funnel analysis to understand where users drop off.
- Use machine learning to predict retention based on cohort behavior.
- Automate reporting to track cohort performance in real time.
- Create dashboards for stakeholders to monitor retention trends.
Conclusion
Cohort analysis is one of the most powerful tools for understanding and improving retention. By grouping users based on shared experiences and tracking their behavior over time, you gain actionable insights that can transform your product, marketing, and customer experience strategies.
Whether you’re running a SaaS platform, an e-commerce store, or a mobile app, cohort analysis helps you move beyond surface-level metrics and uncover the real drivers of loyalty. Start small, iterate often, and let the data guide your retention strategy.